Some notes how to visualize mathematical functions.
Domain and Range
- Input space: domain
- Output space: range or codomain
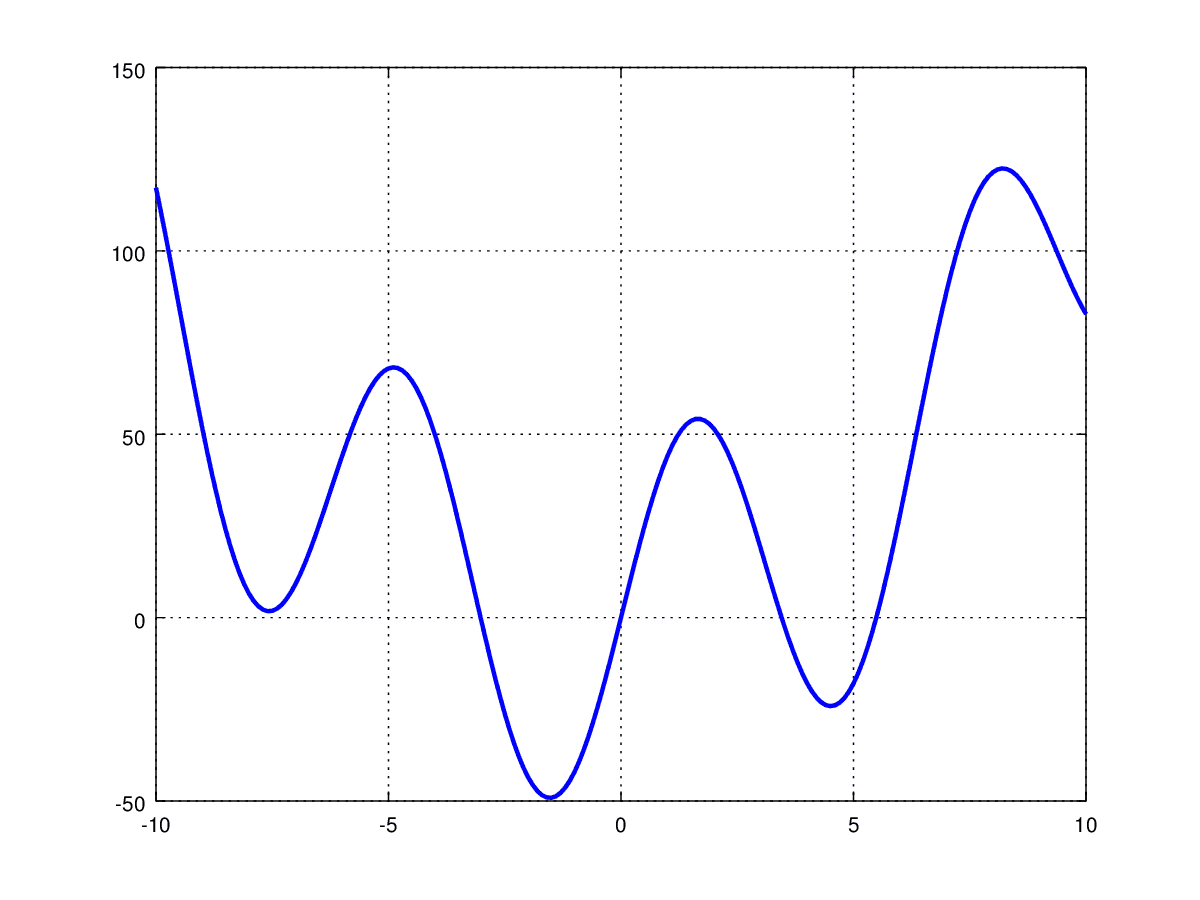
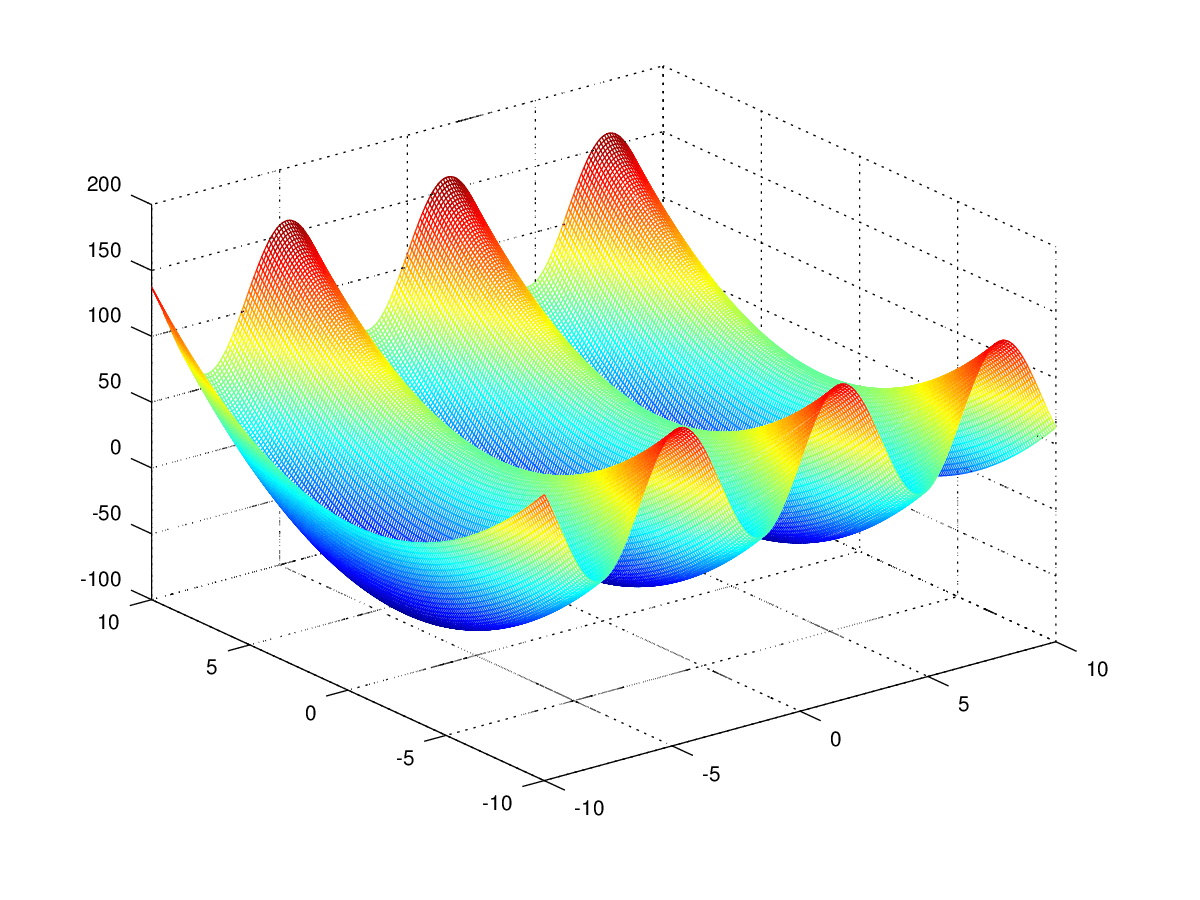
Graphs (single variable functions)
- Showing both ‘input space’ and ‘output space’
- limited in dimension
- used for:
- single-variable functions
- multivariable functions with a tow-dimensional input and a one-dimensional output (represent all points of the form )
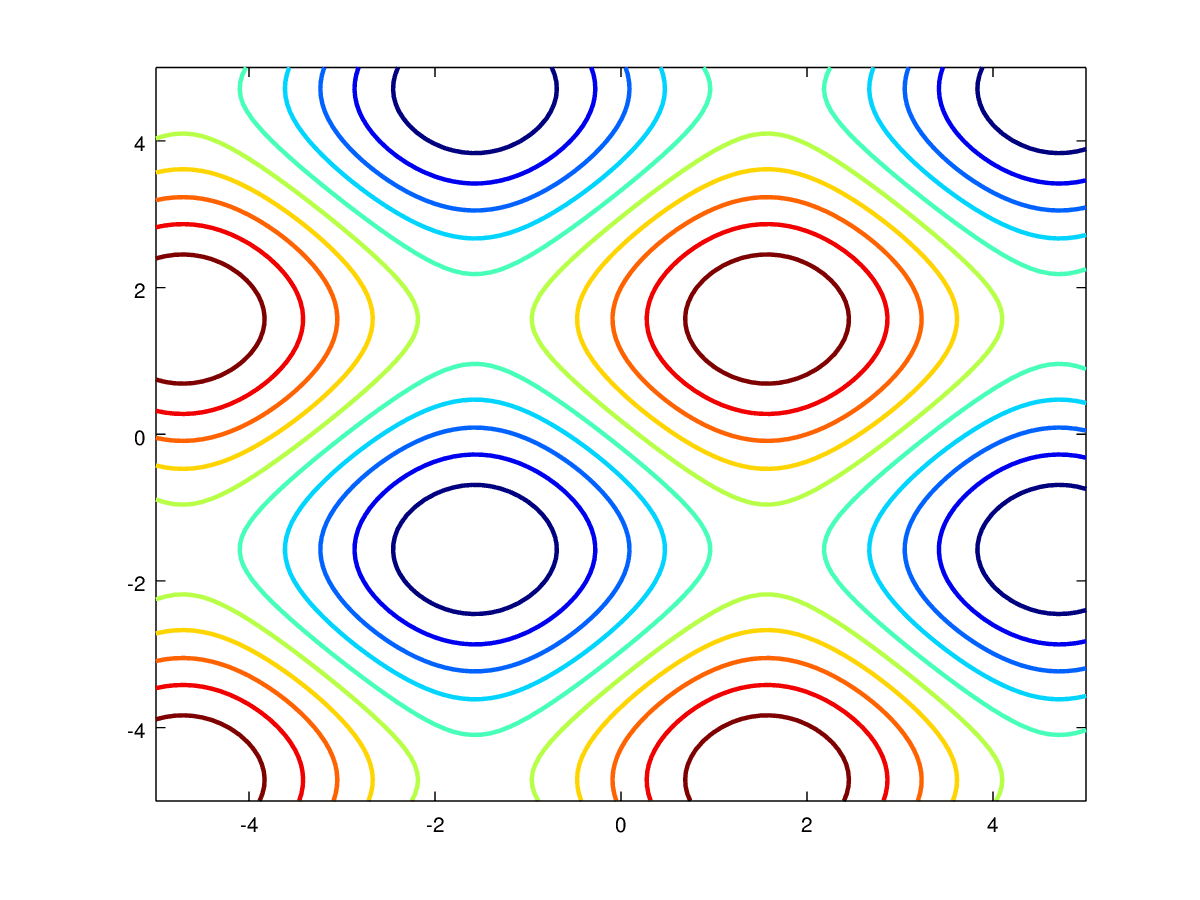
Contour Maps
- Show only the input space
- outputs values represent should be evenly spaced (easier to understand)
- useful for functions with a two-dimensional input and a one-dimensional output
- The Gradient is always perpendicular to the Contour lines
Parametric Curves/Surfaces
- Show only the output space
- used for functions whose output space has more dimensions than the input space
- input information is lost

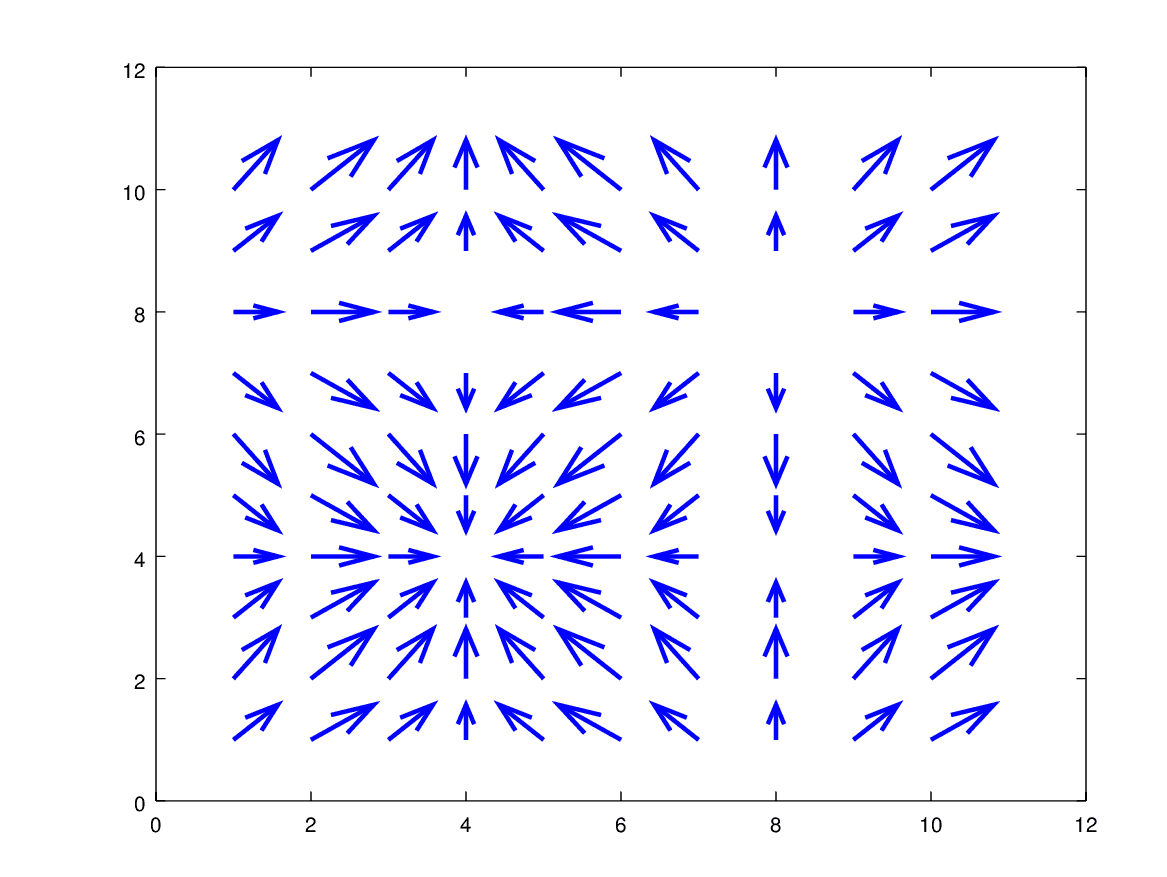
Vector Fields
- Used for functions with same numbers of dimensions in the input space as in the output space
- Associates a vector with each point in space
- The vector lengths are usually not drawn to scale (but proportional to each other)
- Sometimes colours are used to indicate the length of the vectors
Transformations
- Watch (or imagine) how each input point moves to its corresponding output space
- have to be represented as animations or a schematic drawing
- useful for gaining conceptual understanding
- impractical for representing functions precisely
- Can be used for functions with any dimensions in the input- and output space
Plots
The plots were made with Octave with this script.